Employment Structure in Tokyo's 23 Wards: Regular, Temporary, and Part-Time Work
Using census data, we analyze employment in Tokyo's 23 wards by employment type and show how regular and non-regular work coexist in Japan's largest labor market.

Independent insights into income, wages, population, household finances, and regional trends across Japan, based on publicly available statistics.
14 articles (Tokyo's 23 Wards)
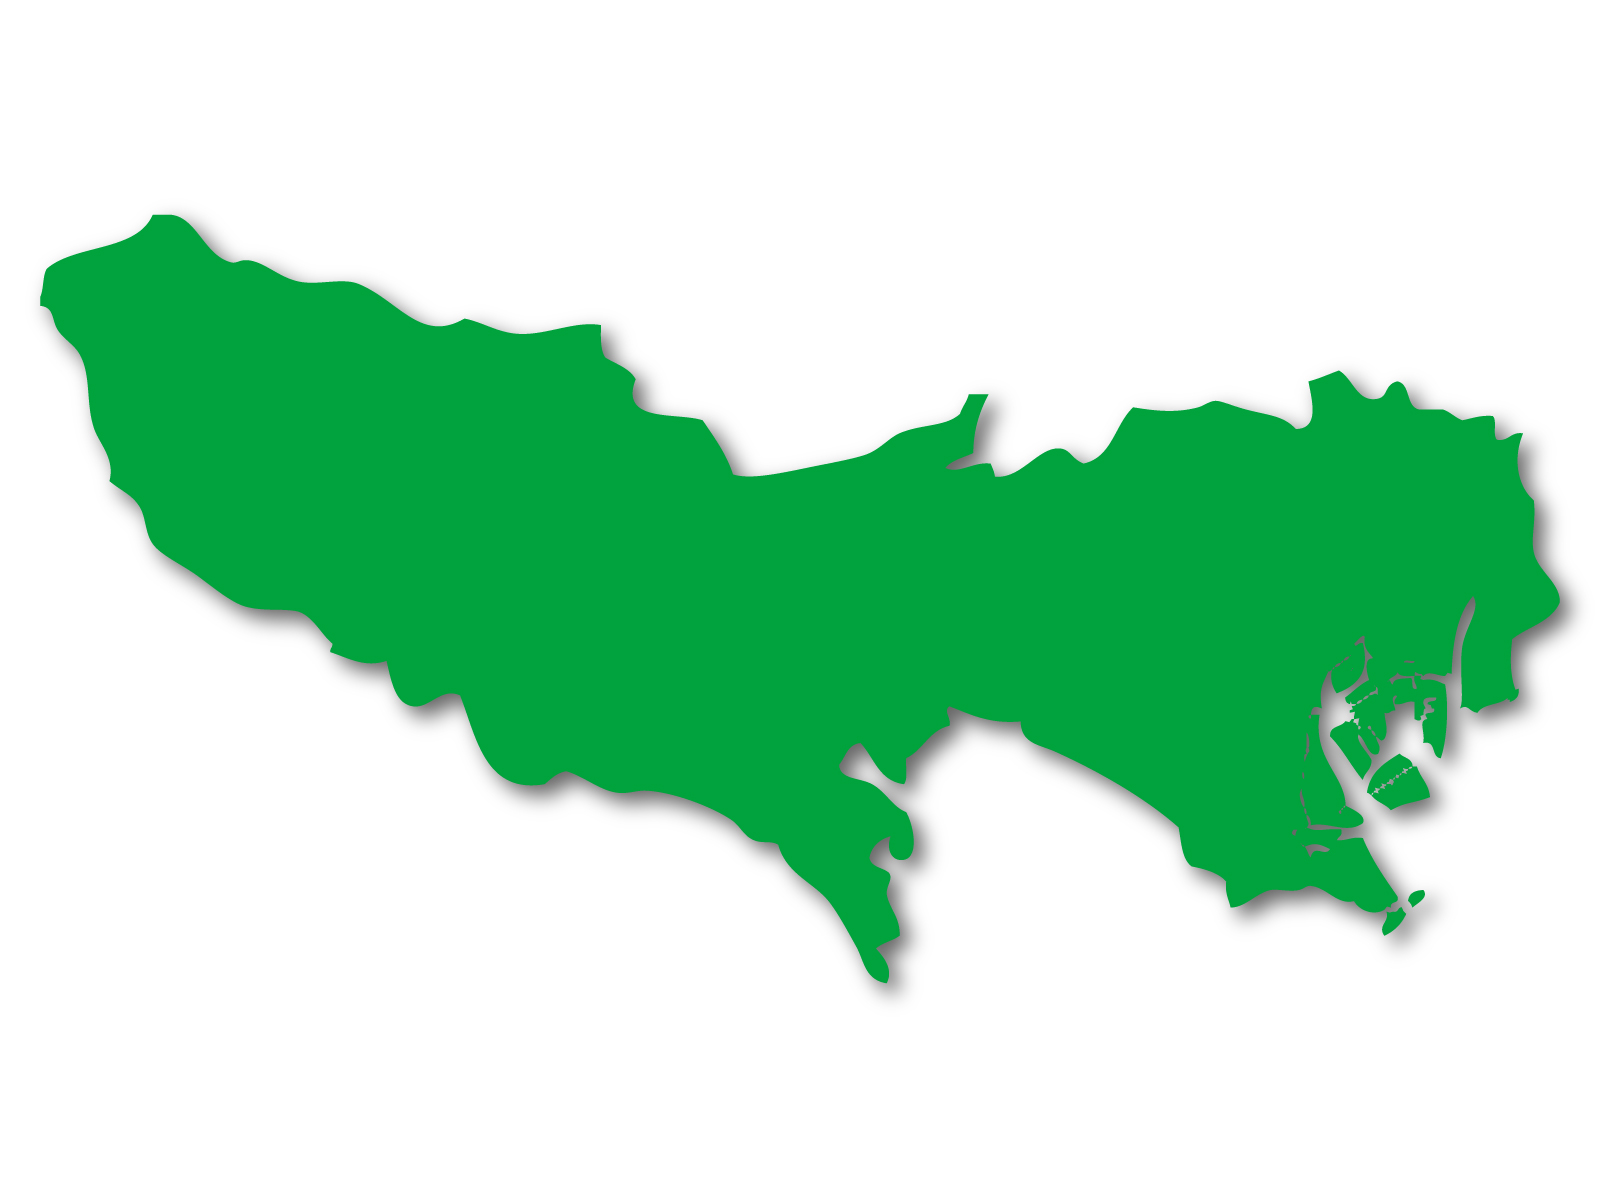
Using census data, we analyze employment in Tokyo's 23 wards by employment type and show how regular and non-regular work coexist in Japan's largest labor market.
Using census data, we analyze daytime and nighttime population in Tokyo's 23 wards. The resident population of 9.73 million rises to 12.35 million during the day, revealing the scale of a work center that draws about 2.61 million net commuters and students into central Tokyo.
Using 2019 National Survey of Family Income, Consumption and Wealth data, we examine financial assets by age in Tokyo's 23 wards and compare the reality of household wealth with common retirement-savings benchmarks.
A comparison of household income for people in their 30s in Tokyo's 23 wards, Kawasaki, and Sagamihara—an age group with many child-rearing households. Using 2019 data, we examine how large the differences are while accounting for unpublished data in other major cities.
Using 2019 National Survey of Family Income, Consumption and Wealth data, this article examines household income by age in Tokyo's 23 wards and explains why the published figures remain among the highest in Kanto.
A comparison of wages across major industries in Tokyo using 2023 data. Chemicals, IT, and finance rank near the top, while accommodation, food service, and personal services sit much lower.
Using 2023 data, this article compares wages by age at large, midsize, and small companies in Tokyo and shows how the company-size gap grows over a career.
A four-year look at wage trends for men and women in Tokyo. This article examines whether the gender gap improved through the COVID-19 period and recent wage increases, with some comparison to Kanagawa.
An age-by-age look at the gender wage gap in Tokyo, Japan's largest economic center. The gap is small in the 20s but widens rapidly from the 30s onward, as the 2023 figures show.
Using Basic Survey on Wage Structure data, this article explains scheduled monthly wages in Saitama by age and gender. The all-age average is ¥347,300, below Tokyo and Kanagawa, but the figures need to be read carefully because the survey is based on workplace location rather than residence.
Using Basic Survey on Wage Structure data, this article explains scheduled monthly wages in Tokyo by age and gender. Wages peak at ¥490,400 for ages 55–59, while the data also show a gender gap that widens with age.
Using FY2023 municipal taxation data, this article compares taxable income per taxpayer across six major Kanto cities. Tokyo's 23 wards lead at about ¥5.39 million, followed by Yokohama and Kawasaki at roughly ¥4.37 million and ¥4.35 million.
Using 2023 Basic Survey on Wage Structure data, this article compares wages by age in Tokyo and Kanagawa. The gap is only around ¥8,000–¥10,000 a month for workers in their 20s and early 30s, but widens to ¥35,300 at ages 55–59 and ¥47,000 at ages 60–64.
Using 2023 data from Japan's Basic Survey on Wage Structure, this article compares scheduled monthly wages across the seven prefectures of the Kanto region. Tokyo ranks first at ¥397,000 a month, about ¥70,000 above Gunma, while Tochigi unexpectedly takes third place.